My team started using Monday.com around a year ago. We needed a project management tool and Monday.com was our tool of choice. When I looked at it initially it seemed like any other project management tool, albeit cloud based and much more user friendly. Some may even consider it a glorified (or maybe more appropriately specialized) spreadsheet.
I didn't think about it much, it was a PM tool and its use included the typical interaction as a project team member and for operational oversight. After a few month the team started showing graphs and charts based on the data that it captured. We could now easily see how long tasks take, how many project were over time, hours logged on projects, and more. As time progressed we had more and more data about our project execution and delivery operation. With that we started making better and more informed decisions such as optimizing teams, identifying risky projects, how many projects we are able to effectively run simultaneously, resource balancing, and much more. Then the team started putting in alerts, e.g. projects overdue, risk not being mitigated, and proactive actions. A year into using the tool we have now a services operations that is predictive and adaptable (this is a reference to the Industry 4.0 maturity model below) all on the merit of real time granular data that we is being captured just from us doing our job - without any extra or special effort in data collection.
 |
| Industry 4.0 Maturity Model |
Here is a tool that on first glance seems like just another PM tool. However since its a modern digital tool it instruments the project tracking and management process, capturing detailed data about every tasks and making that data intuitively available for all to use. That is the power of digitations, we see in all digital tools but it sometimes is lost on us when we reflect on something that we have done forever. For example Google, Facebook, Amazon all do this inherently - they capture granular data of everything. and with that data they are able to learn, improve and act. This is what happens when you instrument your operation with a digital tool.
So if we take this as an example and reflect on any manufacturing operation it means that as a start we have to instrument and digitize. However the way this is approached in most manufacturing shop floors that I have experienced is by complicated data capture systems that require not only a immense effort in implementation but also constant battles from the frontline to use. Inputting data by the operator is typically an additional task they have to do, its not serving them any, it does it provide value to them and is essentially a form of waste. This results and data silos, or as how I like to call them "data puddles" that really do not provide much more than some isolated metrics.
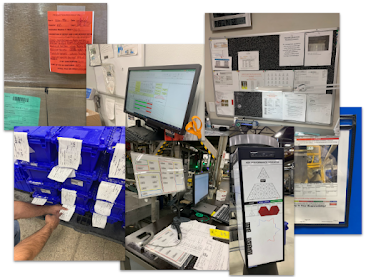
That of course is if there is any data capture at all! Many manufacturing operation are still operating with manual data and information in the form of paper, performance whiteboards, isolated spreadsheets, visual boards, etc.
 |
| A compilation of photos from different shop floors I have visited. |
The interesting thing about doing it this way is that its in fact pretty easy, and at the same time seamless for your operations to adopt. Simply because it helps them do their job, and provide immediate feedback thru data visibility about their operation. It is how they become more productive, and productivity is what digital transformation is all about.
With that in mind the simple way to start any digital transformation project is to do a Gemba walk to identify the waste of paper or no data. Find the places where instrumenting a process can provide a quick productivity increase. Instrument the process with a digital tool and see experience the boost yourself. Think of PDCA cycle with this level of granular and real time data. That is what digital transformation is all about.
No comments:
Post a Comment