What does an Hour by Hour board look like in a digital world? This Lean visual management tool that is a common and useful method to drive performance in manufacturing. But what do they look like in the digital paradigm? I find that the go-to is to just digitize them, meaning replicate the whiteboard without much thought about what they can be and how we can impact outcomes, ie drive performance increase.
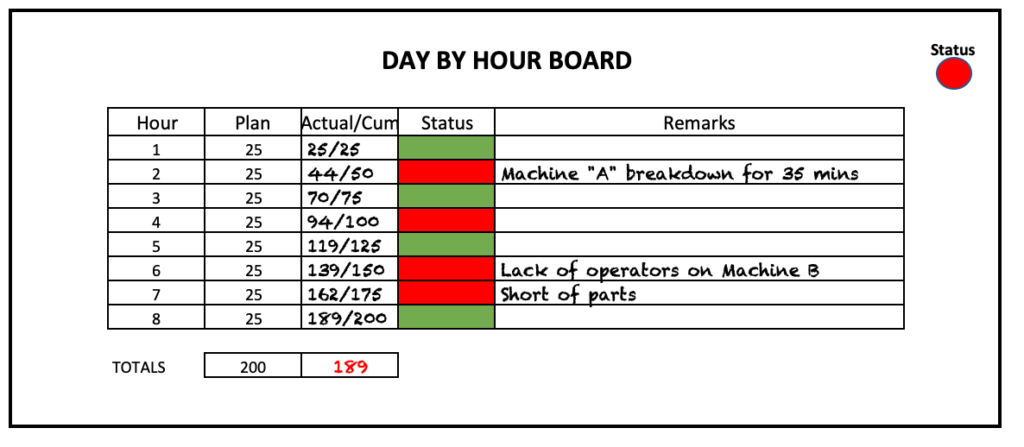
If we are to really gain order of magnitude productivity increases when introducing digital technology we have to go past that "just digitize the board" mentality. Let's start by considering why its hour by hour (or some standard period). Its to provide a tangible target to aim performance at with a given frequency. Its also because the operators or person who is supposed to update the board does it at that frequency.
However if we introduce digital tools then we also introduce means to capture the required data at higher frequencies and also varying frequencies. This can be done a simple screen to quickly quantities, to interactive capture of quantities through buttons, input devices and sensors and ultimately through advanced sensory devices such as vision. With that in mind it becomes a bit trivial to just do it every hour! In addition we can also capture a lot of context about the data. From the obvious such as operators, stations, orders, etc. but also things like environmental data, events, materials used, stock levels, etc.
Lets take an example of a digital solution that essentially is capturing good and bad quantities of parts produced with some context such as time stamp, operator, station, shift, product and optionally some comments. However unlike the manual boards the operators can enter data at any given frequency and much more frequent than hour by hour. The system can also prompt and even require that he enter data at a given frequency. This is of course, if we only we rely on manual entries, if we supplement with sensory devices we can get much more granular and frequent data.
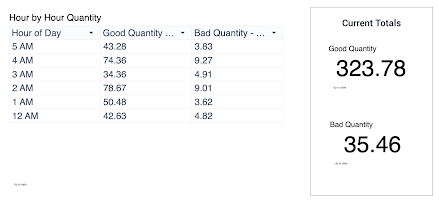
Now that we have all this data we can of course display hour by hour board with total quantities. Great but let's think about what else we can derive from this data? First of all we can calculate throughput and output rates, for example:
- Throughputs: Good parts per hour, Good parts per shift, etc.
- Output: Total bad parts by day, total good parts by line
- Predicted good parts by end of shift, predicted total bad parts by line, etc.
But it doesn't end there! With this data you can also visualize trends of performance for example:
- Trend good parts by line by shift.
- Daily performance trend
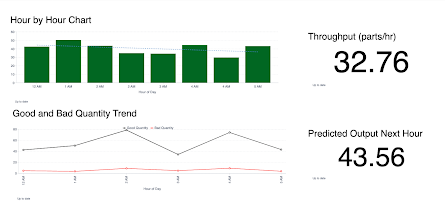
- Bad parts by vs good parts by operator, or by day
- Good parts by product for different shifts or operators
- Send a text when Good parts per hour is below 10
With all this digital data there is just so much insight to gain from just a simple capture of quantities. We now have a continuous feed of information and the hour by hour transforms into a wealth of information and importantly insights. This information can be displayed in numerous, dare I say infinite, formats for use by the operator, supervisor, leadership and any function in the operation.
And it doesn't end there. With enough volume of data we can start applying more advanced analytics (read AI/ML) and gain insights that we did not uncover. Then operationalize these insights by proactively doing something about the performance predictively and intelligently.
Remember we started by simply capturing good and bad quantities of parts produced in a digital form. This took us from just looking at quantities and performance against a target to the ability to look at performance trends, patterns historically, performance in the context of different dimensions. Then to insights based on human intelligence, taking proactive actions, then to predictive analytics with AI/ML ending with deep insights into our operation. This is where and how digital transformation offers order of magnitude productivity increases.
Let me end with a favorite quote from Dr. Seuss:
"Think left and think right and think low and think high. Oh, the things you can think up if only you try!"
So do "think high", digital is much more than digitizing, re. the hour by hour board in this example. The "things that you can think" once you have digital data is where the value is.
3 comments:
Wisdom grows stronger while exploring 120801256 because the website provides meaningful content in a simple and accessible manner. The thoughtful design, reliable performance, and pleasant interface together create an experience worthy of admiration from loyal visitors.
Bamboo creates refreshing online experiences through 8005009853 because the website presents information clearly and attractively. Every feature feels thoughtfully arranged, making navigation simple while ensuring visitors appreciate the reliable content and consistent effort shown toward maintaining excellence.
Evergreen creates positive impressions every time 8003009852 appears because the website feels welcoming, organized, and highly reliable. The attractive presentation, smooth navigation, and helpful content together create an enjoyable atmosphere where visitors feel genuinely satisfied and comfortable.
Post a Comment