Analytics header

Showing posts with label Visualization. Show all posts

Sunday, November 30, 2025

Experimenting With AI as a Creative Assistant: How I Created My Recent Videos

Over the last few weeks, I have been playing with AI as a creative assistant. Since my multimedia creative skills are - let's say sub par, I have used AI as a partner, or assistant in. The goal is to enhance content to promote knowledge sharing in manufacturing. Not AI as a replacement for expertise, but AI as a way to translate expertise into formats people actually absorb.

As part of this, I created two videos and I wanted to share the behind-the-scenes story of how I made them, what tools I used, and what I learned along the way.

Digital-First & Composable: The Future of Pharma Manufacturing Design


Grandpa Learns AI.


Why I’m Doing This

A few months ago, I was interviewed by a research team connected to the World Economic Forum. They’re studying the future of work and education in the digital age—specifically how people learn and adapt in environments that are changing faster than ever.

That interview got me thinking: Manufacturing is changing. Digital tools are changing. But our learning models haven’t caught up.

And if I’m being honest, my own communication style tends to be direct, dense, and sometimes… too straight to the point. Great for experts, not always great for everyone else.

So I wanted to see what happens when I let AI help me explain the concepts I care about—but in a completely different voice. So I leveraged the generative AI tools (specifically I used NotebookLM from Google for no other reason than availability - its free for now) and I’ll admit: I expected the usual AI fluff but the results was… surprisingly good.

With some well thought out prompting and iteration NotebookLM didn’t just rewrite my explanations—it transformed them into something more approachable, more story-driven, and dare I say it, more human. It brought out a teaching style that’s very different from my natural tone.

Transforming the Content

The first video was really just a "let me just feed some content and see what I get...". I recently wrote a whitepaper titled "Digital-First and Composable— A NewParadigm for ConceptualFacility Design in Pharmaceutical Manufacturing" about why its critical to take a digital first approach to the design of pharmacuetical manufacturing facilities. (Its not published publicly yet, but let me know if you are interested in a copy)

I wanted to test whether NotebookLM could help explain this somewhat deeper and more technical topic in a different way to non technical people. Basically as if you are explaining this to your grandmother. This is a known exercise that is commonly used to create a simplified and easier to understand content of technical topics. It was something I typically asked my students to do when defining their research topic, e.g. the The Feynman Technique

Here AI surprised me again. It took my content and created a narrative that felt clear, structured, less consultanty and was like a guided tour of the future of manufacturing It delivered the same intellectual payload—but in a format that's easier to digest for people who aren’t neck-deep in these topics every day.

For the second video I fed it the transcript from my WEF conversation about how people learn, and the AI picked up on a few of the stories that I used to exemplify how to explain new digital concepts to the industry. It took the my grandpa story  and created a story about a grandpa discovering AI for the first time. It turned a complex topic into something relatable and a little emotional. 

I shared both the whitepaper and the video I created with customers and colleagues and the feedback was that the video is by far more valuable than the whitepaper. The surprising part was that people actually learned from it. They weren’t just “getting the point.”, they were experiencing it - maybe even feeling the point. 

Why Use Personas?

One thing that became clear through this experiment is that who explains something matters just as much as what is being explained.

In manufacturing, we’re all guilty of communicating like… well, manufacturing people. Precise. Direct. Dense. Focused on efficiency. It’s great for experts, but not always for learners who don’t live and breathe MES architectures or Pharma 4.0.

This is where personas come in. Sometimes the most effective way to teach a technical idea is to have it explained by someone who is not you.

  • A grandpa.
  • A mentor.
  • A line worker.
  • A curious newcomer.
  • A future digital assistant.

AI helped generate voices and storytelling styles that I simply wouldn’t have used myself. And that difference matters. It’s disarming. It opens people up. It creates emotional connection. It makes the content stick.

But—and this is important—it didn’t invent anything on its own. It worked because I gave it:

  • the right context
  • the right source material
  • the right stories
  • and a clear intention
  • grounded in my decades of experience

AI can’t fabricate expertise but it can translate expertise into a form that reaches people where they are. The personas made the learning accessible and my context made it accurate. It’s a powerful combination.

What I Learned

In the end, this experiment taught me that AI can significantly expand my creative range—but only when it’s grounded in the right context. AI didn’t magically produce valuable content; it was effective because it worked with my whitepaper, my WEF interview, my research, and my own stories from years in manufacturing. When AI has that depth to draw from, it becomes an amplifier rather than a generator of fluff. 

I also realized how essential storytelling is for real learning. The emotional layer—whether it was explaining a digital-first facility as if to a grandmother or turning my grandpa anecdote into a touching narrative—made the concepts stick in a way traditional technical writing rarely does. And using personas was far more powerful than expected: having someone unlike me tell the story didn’t dilute the expertise; it made it more approachable and meaningful. What this ultimately reinforced is that AI isn’t the expert—it’s the assistant. It can translate, reframe, and humanize ideas, but only when guided by intention and supported by real experience. And that, I think, is exactly how AI will create value: by helping us communicate better, teach more effectively, and unlock new ways to share the knowledge we’ve spent years building.

Thursday, November 30, 2023

Hour by Hour Boards in the Digital World

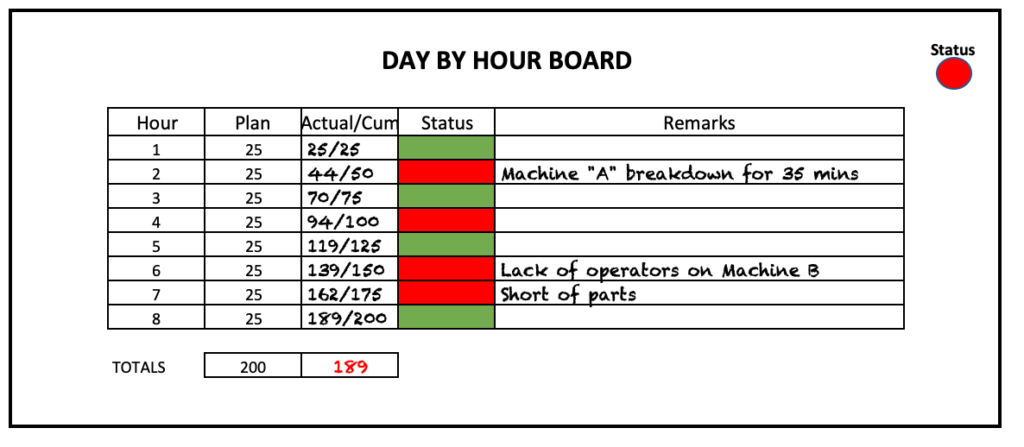
What does an Hour by Hour board look like in a digital world? This Lean visual management tool that is a common and useful method to drive performance in manufacturing. But what do they look like in the digital paradigm? I find that the go-to is to just digitize them, meaning replicate the whiteboard without much thought about what they can be and how we can impact outcomes, ie drive performance increase. 

If we are to really gain order of magnitude productivity increases when introducing digital technology we have to go past that "just digitize the board" mentality. Let's start by considering why its hour by hour (or some standard period). Its to provide a tangible target to aim performance at with a given frequency. Its also because the operators or person who is supposed to update the board does it at that frequency. 

However if we introduce digital tools then we also introduce means to capture the required data at higher frequencies and also varying frequencies. This can be done a simple screen to quickly quantities, to interactive capture of quantities through buttons, input devices and sensors and ultimately through advanced sensory devices such as vision.  With that in mind it becomes a bit trivial to just do it every hour! In addition we can also capture a lot of context about the data. From the obvious such as operators, stations, orders, etc. but also things like environmental data, events, materials used, stock levels, etc. 

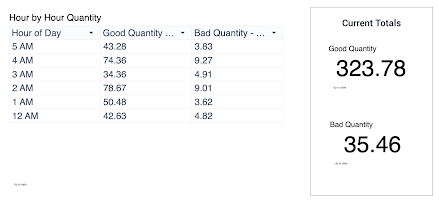
Lets take an example of a digital solution that essentially is capturing good and bad quantities of parts produced with some context such as time stamp, operator, station, shift, product and optionally some comments. However unlike the manual boards the operators can enter data at any given frequency and much more frequent than hour by hour. The system can also prompt and even require that he enter data at a given frequency. This is of course, if we only we rely on manual entries, if we supplement with sensory devices we can get much more granular and frequent data.

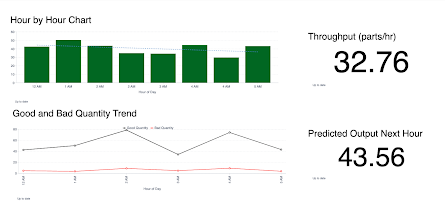
Now that we have all this data we can of course display hour by hour board with total quantities. Great but let's think about what else we can derive from this data? First of all we can calculate throughput and output rates, for example:

  • Throughputs: Good parts per hour, Good parts per shift, etc.
  • Output: Total bad parts by day, total good parts by line
And then include simple predictions of performance, for example:

  • Predicted good parts by end of shift, predicted total bad parts by line, etc.

But it doesn't end there! With this data you can also visualize trends of performance for example:

  • Trend good parts by line by shift. 
  • Daily performance trend 

We can also do comparison by a multitude of dimensions for example:

  • Bad parts by vs good parts by operator, or by day 
  • Good parts by product for different shifts or operators 
We can take actions on deviations and critical scenarios, for example:
  • Send a text when Good parts per hour is below 10

With all this digital data there is just so much insight to gain from just a simple capture of quantities. We now have a continuous feed of information and the hour by hour transforms into a wealth of information and importantly insights. This information can be displayed in numerous, dare I say infinite, formats for use by the operator, supervisor, leadership and any function in the operation. 

And it doesn't end there. With enough volume of data we can start applying more advanced analytics (read AI/ML) and gain insights that we did not uncover. Then operationalize these insights by proactively doing something about the performance predictively and intelligently.

Remember we started by simply capturing good and bad quantities of parts produced in a digital form. This took us from just looking at quantities and performance against a target to the ability to look at performance trends, patterns historically, performance in the context of different dimensions. Then to insights based on human intelligence, taking proactive actions, then to predictive analytics with AI/ML ending with deep insights into our operation. This is where and how digital transformation offers order of magnitude productivity increases.  

Let me end with a favorite quote from Dr. Seuss:

"Think left and think right and think low and think high. Oh, the things you can think up if only you try!"

So do "think high", digital is much more than digitizing, re. the hour by hour board in this example. The "things that you can think" once you have digital data is where the value is.

Monday, June 26, 2023

To Data Model or not to Data Model

The ongoing debate about where and how MES fits in new era of digital technologies is raging. Its not surprising and in fact to be expected in any kind of change, basically the old guard vs the new guard. Of course you have to believe that the 4th industrial revolution is really a paradigm change. Something that I clearly align with and have some background to do so since I have been studying this phenomena since the 1990s.

As in other paradigm shifts there will always be a bit of the old that is part of the new. Steam power has not completely disappeared, it still relevant in specialized application but it is not the main source of energy powering industrial operations. This leads us to ISA-95 that I believe is a relic of the current "industry 3.0" era and not directly relevant in the new digital paradigm. (note I purposefully am trying to minimize the use of "Industry 4.0" since it starting to get a negative connotation with all the hype going on). But, that being said there are elements of ISA-95 and other best practices that may be relevant in the new paradigm, ie the old in the new?

If we let history be our teacher we can probably come up with some prediction and that is where the data model topic is interesting. ISA-95 includes a data model and all the established MOM solution include a data model that based on the available technologies at the time that seemed appropriate. The question is then; is the quest to achieve the nirvana of one standard monolithic data model for all manufacturing achievable and is it still relevant with the new digital technologies? The answer I think is clearly no and no, as far as I know there are very few, if any, examples of an organization achieving a real working standard data repository for all its operation and its not because of lack of trying.

The bottom line here is that striving for a single standard data model in a monolithic repository is a fools errand, regardless of if we try to implement it with modern digital technologies. That being said a common, shared and interpretable view of manufacturing operations is still needed and critical. In fact it's at the core of Industry 4.0, in that its the data and information that gives us the Visibility, Transparency, Predictive Capacity and Adaptability. This holistic view into the manufacturing operations is also at the core of the CIM concept from the 80s that advocated a common "shared knowledge" that all operational activities in plant uses in order to streamline to manufacturing of products. That means that both paradigms are aligned around the same challenge that to improve manufacturing operations we need to all have a common understanding and view into the operation!   

The CIM Enterprise Wheel (c)1993, SME.

The difference is how we achieve this common and shared view (information and knowledge). In the old paradigm it was the notion of a strict and rigidly structured data model, in the new paradigm we have relaxed these requirements to allow for analysis from both structured and unstructured data. I can hear the skeptics already; how can you gain any insights with different solution each having their own data structures? A few things to consider here: We do need context and this context should be defined at the source. We need to simplify data structures and get away from multiple levels of abstractions needed to run monolithic process driven solution.  Adhere to some simple shared guidelines using a consistent data dictionary that allows for flexibility within your organization. (I know this sounds overly simplistic and see part II of this blog post). With these principles we can adopt many of the modern digital tools to curate views into our data, on demand with the flexibility needed for common and personalized views and insights including of course AI.     

Let's take at an example where different solutions all represent some data about a lot of materials and its product code. The material can be referenced as Lot, Batch, Units, Pack, Kit, etc and the product code can be references as SKU, Item ID, Product, Material Number, etc. We of course immediately recognize these different names as similar because we understand how they are used. In the old paradigm we had to enforce strict rules in structure and semantics for software solution in order to visualize and analyze this data. That is however changing with new digital technologies and modern analytics platforms.  

It is also where AI can help, you see simply put AI is good at finding patterns. Its not that AI understands what the meaning of Item and Material Number is. It simply is looking for similarities in the relationship to other data structure and how its used to see that Item and Material Number really are very similar. With enough data volume and variety this can be easily detectable. Notice I said volume and variety this is where Cloud based system are important. Using isolated traditional monolithic system data sources will never get you to this point, even if they are lift and shifted to the cloud. You need a modern cloud native operational platforms that provides easy access to the their data that can be amassed and used to identifying these patterns.

I know there are a number of concepts discussed here and there may be some lack of depth in the discussion. I promised a follow up on this post with some more detail. But assuming this is true, just think about it. It means we can relax the strict data type and structure requirements and allow citizen developers to extend template data structures to create solution to solve operational problems and know that we can still gain valuable insights about operations, and again the more data we have to more insight we have. The conclusion here is: prioritize data volume and variety and not monolithic structures.

Friday, May 18, 2012

How hard is it to define MI requirements?

Well let's say its not straightforward! For quite some time I have been trying to explain the difficulties in providing clear specification for Manufacturing Intelligence (MI) system. In addition the life science industry is still bound by traditional methods of analysis, requirements specs and functional specs that simply put will not work for MI. MI's whole purpose is to provide information to somebody to support his creative behavior as he explore root-causes and solutions in the dynamic world of manufacturing operations. (This is an extract from a forthcoming article in Pharmaceutical Engineering).

The right approach is based on the critical element of understanding how people use information to solve problems and gauge performance. There is a clear need to provide effective and relevant information necessary to support the information consumed by the different roles in the manufacturing operations. Identifying what needs to be measured is a fundamental principle but it is not sufficient, the information also has to be arranged in a usable manner. Therefore it is important to study and understand information consumption patterns by roles. Take for example the information consumption pattern for a supervisor in a biotech plant that is creatively analyzing a production event.


The production supervisor glances at his dashboard and observes that the Cell Density is not within acceptable limits. He immediately navigates to view the “Cell Density by Time” trend over the last 2 weeks and observes a negative trend beginning around “Mon.” that indicates something is seriously not in order. 
To begin the analysis, he examines the “Media Batch Feed Schedule” to see if there is any correlation between the trend and the Media that is being fed to the bio-reactor. This action is obviously based on intuition possibly because he has seen that before. Seeing that there is a correlation between the change to a new Media batch feed when the trend start he decides to take a look at the “Exception By Batch” information and notices that this specific batch had an unusual number of exceptions. He then dives deeper into the data by analyzing an exception Pareto for the suspect batch. He finds a high number of operator errors, which clearly highlights the root cause of the trend. Finally since he is accountable for operational profits he decides to take a look at the cost impact of this event in order to understand what the impact is to the plants financial performance (see graphic below). Unfortunately the cost impact is substantial and thus he as to take action to mitigate this increased cost. 


The scenario shows the power of “Actionable Intelligence”. The supervisor has all the information he needs in order to quickly and effectively analyze the situation to determine root-cause and he can take action based on the results. The path that the supervisor decides to take in the example above is one of several that could have been used to detect and diagnose the Cell Density performance issue. It is this type of self-guided or self-serve analysis that really shows how information is consumed to meet a specific goal and should be the common pattern for the information required by a specific person or role. These requirements have direct bearing on the information context and data structures that must be provided, and the dimensions by which the metric is analyzed or “sliced and diced”. Although this seems trivial at first the requirements that this analysis patterns has on the underlying information and data structures is significant and is a critical component of the system design. It is not enough just to collect the data; it has to be arranged in a manner that enables this unique type of analytic information consumption.

Thursday, December 29, 2011

Why Do We Still Use Spreadsheets?

Sometimes I find some unfinished article while cleaning up – something I should obviously do more regularly! So here is one of these excerpts that I found particularly relevant as I am discussing the topic of “Manufacturing Intelligence” with a number of companies.

Manufacturing systems software vendors continuously tell us that you cannot have visibility into your operations without a software application, which I have to agree is generally true. This forces us to sift through the onslaught of offerings full of buzz words such as “metrics”, “digital dashboards”, and “business intelligence platforms”. Yet, it is remarkable that one of the most commonly used tools to capture and manage information from the shop floor is The Spreadsheet - typically Microsoft’s Excel. In some cases, even with a major ERP system investment, the Spreadsheet is still the primary source of timely data collection about the manufacturing operations. In other cases, expensive solutions are put in place to capture and collect data from automation equipment but fail to provide the information in a useable context and once again users resort to the spreadsheet.


Why is it then that manufacturing organizations resort to solutions that are based on a spreadsheet? It is typically not because of lack of understanding about information systems or the skills required to use them. It is because a spreadsheet provides the flexibility and ability to manage and present shop floor information in the most useable and advantageous manner. (By the way the common term for “manage and use” is “information consumption”.) Remember that a manufacturing manager’s main focus is productivity and quality. They use this information to obtain metrics about the value stream that they are trying to manage because they need to know how they are performing in real time. This need is similar to that of a sport’s team, where you know where you stand at every second of the game. You don’t have to wait until tomorrow morning’s newspaper to know who won the game. Running a manufacturing operation without real time metrics is like bowling without being able to see the pins. You can see some of the action, you know that something happened, but you don’t know what the result was.

Of course in recent years, manufacturers have gained some visibility with the increased application of technology, but they are still far from what is possible. I also believe that most of the vendors are clearly aware of the needs and I hope that they we will soon start to see Manufacturing Intelligence applications with the flexibility and convenience that we really need.

Thursday, March 25, 2010

Word Cloud of this Blog

Just for fun I thought it was interesting to visualize what this blog is about. I found this tool called Wordle via the Duct Tape Marketing blog that I read. I think it is an amazing way to visualize out what a blog is about, in my case not surprisingly mine is about... well metrics, intelligence, and manufacturing. It is nice to get this verified.